


Psychrometric Chart
Psychrometric chart or Hygrometry chart is the graphical representation of thermo-physical properties of gaseous-vapor mixture or one can say, moisture.
You might have seen psychrometric chart comprised of various complicated lines. This is little-bit confusing. Here In this Article we will go through complete details regarding Psychrometric Chart and the various lines.
With the help of Psychrometric chart one can calculate the basic conditions and various properties of gaseous -Air mixture
Psychrometric chart also plays a crucial role in troubleshooting greenhouse related environmental problems and helps out in determining solutions. Understanding psychrometric charts helps visualization of environmental control concepts such as why heated air can hold more moisture, and conversely, how allowing moist air to cool will result in condensation.
Moist Air is nothing but it is a mixture of two ideal gases (i.e vapor and air). In this Article we consider Dry Air as a fixed component of the vapor-air mixture or (mass of dry air remains constant ) where as mass of water vapour is a variable component.
The objective of this Article is to explain the various characteristics and properties of moist air with the help of psychrometric chart. All changes in the properties of air can be described graphically on a psychrometric chart. Psychrometric charts are available in various pressure and temperature ranges.

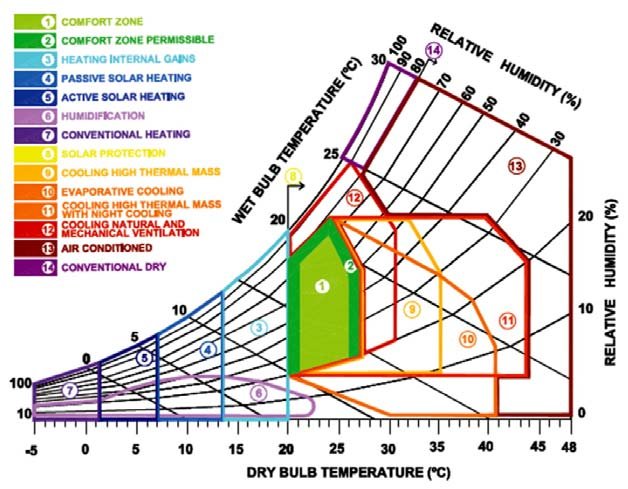
Here, boundaries of the psychrometric chart are comprised of dry-bulb temperature scale on the horizontal axis (
abscissa ), and humidity ratio (moisture content)(
ordinate ) scale on the vertical axis. where as an upper curved boundary represents saturated air or 100 percent moisture holding capacity.
Here in this psychrometric chart Vertical lines are represents the isotherms. As we go upward along the vertical line, the humidity ratio increases (e.g. addition of external water, e.g. by evaporation). while Going downward along the line, Humidity ratio decreases (e.g. condensation, absorption or adsorption of vapour that is subtracted from the atmosphere; the term ‘adsorption’ implies the condensation of the vapour on the surface or in internal porosities of solids).
For a constant/given humidity ratio horizontal lines are simply the isohumes. A displacement to the right indicates warming of the system without change in humidity ratio; a displacement to the left, cooling, and according to our previous definition, the final point of this “horizontal” cooling is the dew point.
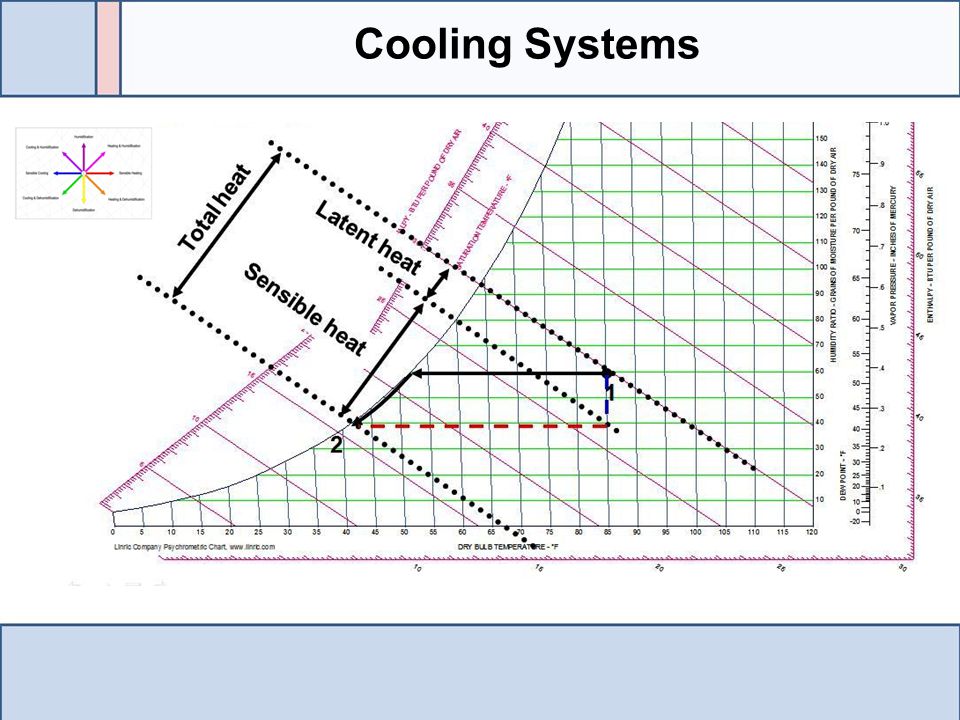
The chart shows other important gas-vapour mixture properties as diagrammed in above mentioned figure such as : wet-bulb temperature; enthalpy ; dewpoint or saturation temperature; relative humidity; and specific volume.
Let first see the Definitions of these above terms.

- Saturation humidity line:
- Saturation Humidty line, Humidity Ratio or Absolute humidity (AH) is the amount of maximum possible vapor in the dry air for a given operating conditions (P & T) ; can be termed mass of water vapour in grams per kg of dry air, i.e. g/kg.

- Relative humidity line: Relative humidity (RH) is an expression of the moisture content of a given atmosphere as a percentage of the saturation humidity at the same temperature:
RH = 100 x AH/SH (%)
The relative humidity lines are plotted on the psychrometric charts represented in yellow color. It is “relative” with respect to the amount of water that air, at that same temperature, can hold at 100 percent humidity, or saturation.Relative humidity is an indicator of how much moisture is in the air compared to desirable moisture conditions
Note : If the Relative humidty is less than that of sample of air has got higher capacity or larger capacity of absorbing water-vapor .

- Dry Bulb Temperature : In this chart Lines of constant dry bulb temperature is represented by lines going vertically up. The dry bulb temperature is the present temperature of air measured by a just putting a bare thermometer in air. It is called “dry-bulb” since the sensing tip of the thermometer is dry (see “wet bulb temperature” for comparison).
- When the dry bulb temperature line reaches the saturation line the following conditions exist.
- Relative Humidity = 100%Wet Bulb Temperature = Dry Bulb Temperature Dew Point Temperature = Dry Bulb Temperature
Wet Bulb Temperature

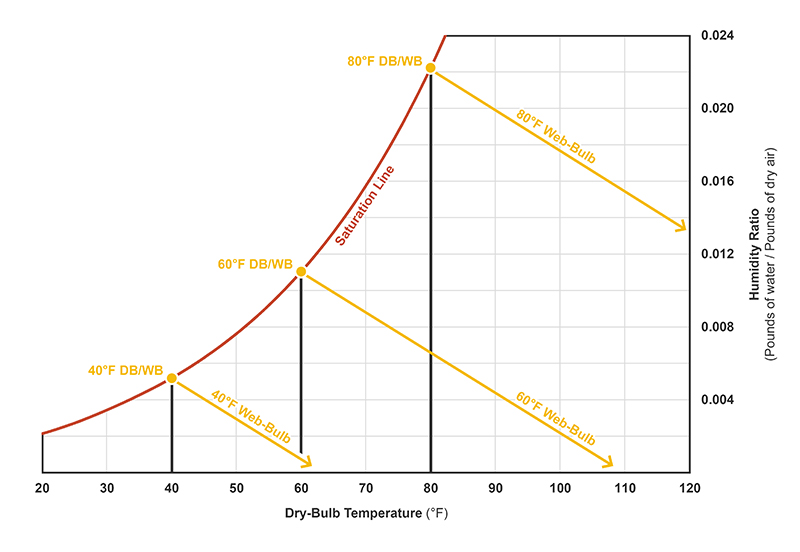
Wet-bulb temperature is determined when the sample of air is past over the sensor or thermometer bulb which is wrapped with a wick or layer of cotton maintained in moist condition. It represents the temperature at which water evaporates and brings the air to saturation. Inherent in this definition is an assumption that no heat is lost or gained by the air.
When the sample of Air is saturated then Wet Bulb Temperature (WBT) is equals to Dry Bulb Temperature(DBT), whereas if sample is not saturated then WBT will be lower than DBT. This is known as Wet Bulb Depression.
Dewpoint temperature : Dew point temperature indicates the temperature at which water will begin to condense out of moist air at a given operating temperature and pressure.
ImageSource : Healthy Heating ; SlidePlayer;
researchgate.net