


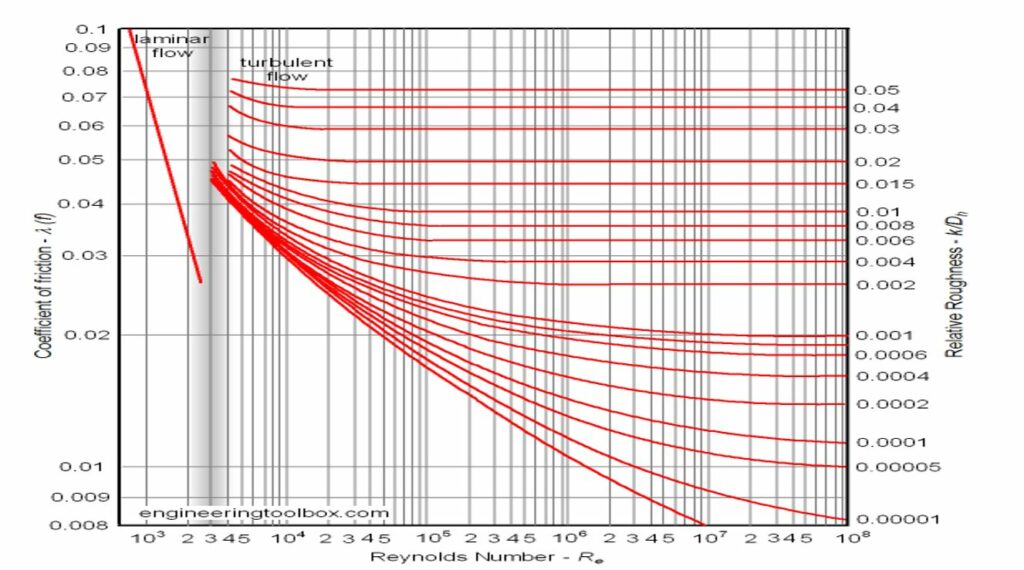
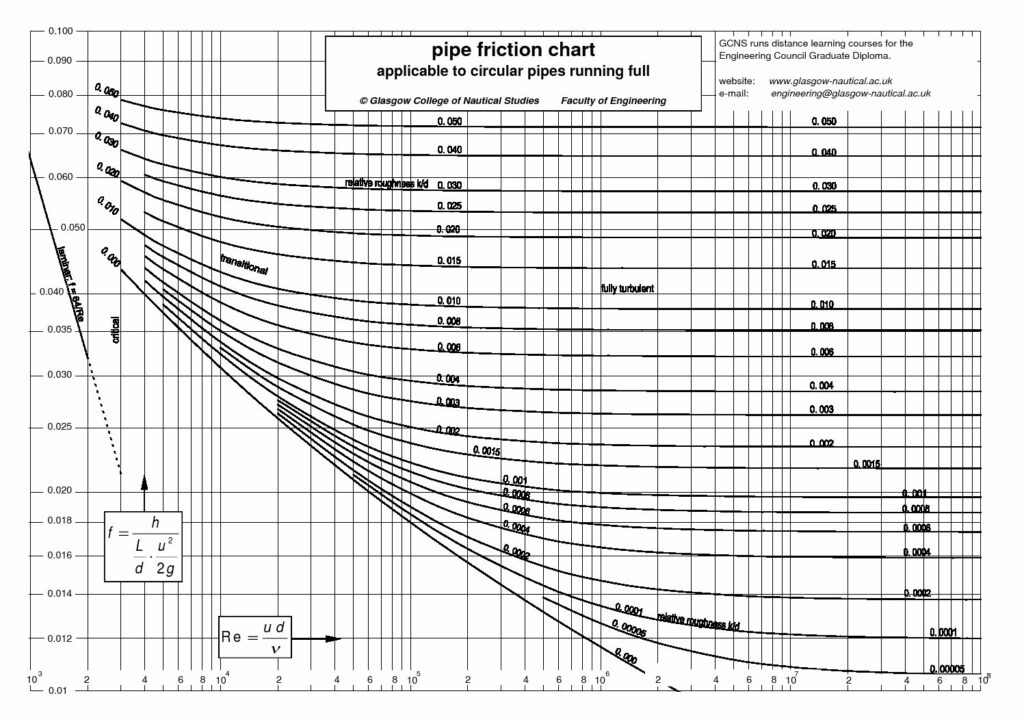
Moody Chart or Moody Diagram
- In Fluid Mechanics, the Moody chart or Moody diagram is a graph which relates the Darcy-Weisbach friction factor (fD ), Reynolds number (Re), and surface roughness for fully developed flow in a circular pipe.
- It can be used to predict pressure drop or flow rate down such a pipe.
-
This diagram is used to estimate friction coefficients by Darcy-Weisbach major loss equation

Read Also About Flow Measurement Devices
Open Channel Flow Measurement
Vortex flow meter
Electromagnetic Flow Meters
Types of variable area flowmeters
Venturi Flow Meter
Coriolis Mass Flow Meter
Orificemeter
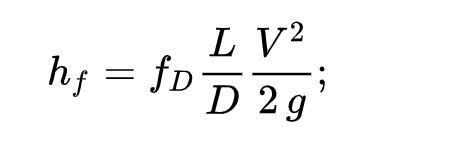
This non-dimensionl chart is used to calculate pressure drop, ΔP (Pa) (or head loss, hf (m)) and flow rate through pipes. Head loss can be calculated using the Darcy–Weisbach equation in which the Darcy friction factor fD appears :

We can rewrite the above equation in terms of fanning friction factor as :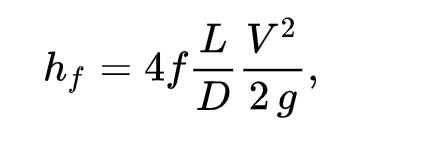

Where fD =4*f (Relationship between darcy friction factor and fanning friction factor).
Hence Pressure drop in the flow field can be calculated as :
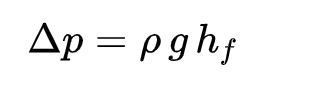

or,
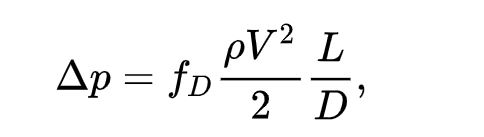

where,
ρ : density of the fluid,
V : average velocity in the pipe,
fD : friction factor from the Moody chart,
L : Characteristic length of the pipe
D : pipe diameter.
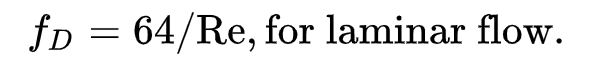
The Moody chart can be divided into two regimes of flow: laminar and turbulent. For the laminar flow regime (Re < ~2000), roughness has no discernible effect, and the Darcy–Weisbach friction factor fD was determined analytically by Poiseuille:


ArticleSource : Wikipedia;
ImageSource : Engineering Too Box